
07 Aug Connecting the Dots with Indirect KPIs

As business intelligence and analytics continue to add value to supply chain organizations, how do we gain even more value? With an increase in data and the sources of information – from supply chain systems to customer systems to supplier management systems, a source of business value can be achieved by correlating a group of metrics from disparate systems to provide insight and cause/effect relationships. Correlating metrics in this manner is called indirect KPIs vs. the conventional manner of developing KPIs referred to as direct KPIs.
First, lets review the difference between direct KPIs and indirect KPIs.
Direct KPIs are the metrics which result from drilling down or drilling up on metrics. In a typical supply chain organization, an example can be Inventory:
-
- Inventory (Primary KPI)
- RM Inventory (sub-metric of Inventory)
- WIP Inventory (sub-metric of Inventory)
- FG Inventory (sub-metric of Inventory)
- Inventory (Primary KPI)
Assuming no other type of inventory exists the business, just adding up raw material inventory, work in process inventory and finished goods inventory calculates Inventory for an organization. Another example of a direct KPI is Revenue and different kinds of revenue:
-
- Revenue (Primary KPI)
- Revenue by Division (sub-metric of Revenue)
- Revenue by Division by Location (sub-metric of Revenue by Division)
- Revenue by Division (sub-metric of Revenue)
- Revenue (Primary KPI)
Most supply chain analytics systems work in this manner, since the data is collected from similar systems and analytics are rolled up in a very straightforward manner.
Indirect KPIs are those which impact KPIs not found within a straightforward “drill-down” or “drill-up” manor; these are KPIs which correlate to or impact other KPIs. Indirect KPIs are much harder to determine (vs. simply adding up numbers in our earlier inventory or sales examples), but can provide insights into supply chain issues and drive improvements.
Normally, direct KPIs can tell a business what happened, whereas indirect KPIs can help organizations learn what to do differently by connecting the dots to determine factors which truly impact performance.
How to connect the dots
First, start with tribal knowledge. Ask some basic questions about the key metrics which need improving and any general knowledge of what impacts them:
What causes product to be late?
Is it delays in manufacturing?
Poor yields?
Late suppliers?
Supplier quality?
Each of the potential reasons open up a new set of KPIs. Rather than continuing infinitely, drill down and across into the KPIs until a set of actionable KPIs can be focused upon. Remember:
KPIs just for visibility are interesting, KPIs where action can directly impact a business metric are focus areas.
Once the dots are connected which can lead to a business-impacting metric, determine the data source for all the KPIs in the Indirect KPI trail of dots. Think out of the box on this trail dots – these may not be static data sources (your ERP system, your accounting system, etc.). These KPIs can be managed by apps (or mini-apps). An important factor is how often these KPIs are refreshed. If 1 KPI is refreshed in real-time and another is refreshed on a quarterly basis, the accuracy and actions-to-take may be harder to develop.
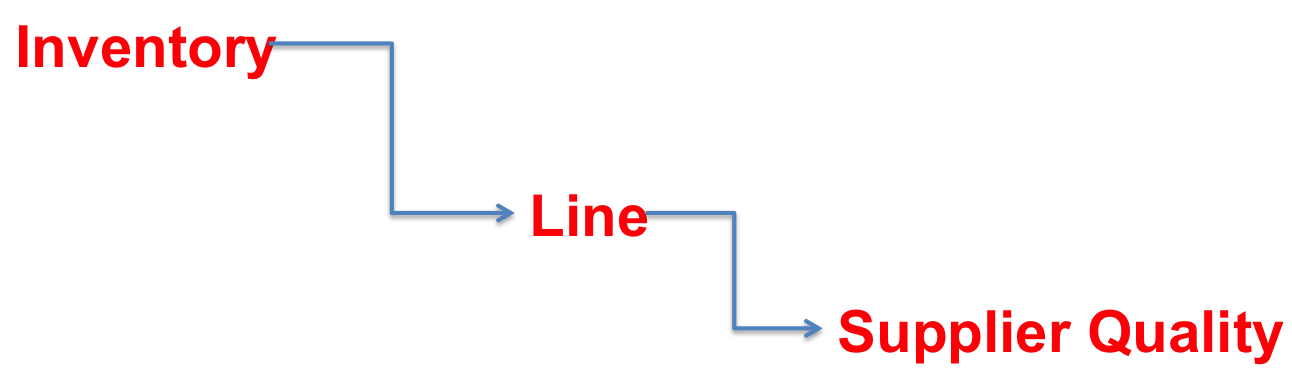
In the example below, the organization is struggling with Adherence to Plan – a metric which defines the date and quantity of finished product to a distribution center. One of the direct KPIs of Adherence to Plan is Inventory. A direct KPI of Inventory is WIP inventory. Since WIP is high, we can access data and metrics from manufacturing and supplier management and determine that poor supplier quality of raw materials is causing rework, causing ATP to fall short.
Connecting the dots with Indirect KPIs

Summary: Using the above example, by managing Indirect KPIs, we find that supplier quality inconsistency is adversely affecting Adherence to Plan.
[optin-monster-inline slug=”qloggraxd3payfghmxer”]
