
Improve Your OEE with Sage Clarity Solutions
What is Overall Equipment Effectiveness?
OEE (Overall Equipment Effectiveness) is a calculation to measure the percentage of manufacturing time that’s productive. OEE is composed of three other metrics that factor into its overall score—quality, performance, and availability.
OEE Definition:
OEE is a Calculation of Availability X Quality X Performance
Example: 91% Availability x 93% Quality x 84% Performance = 71% OEE
Continuously Improve Your Manufacturing Output
Sage Clarity OEE Accelerator Apps provide data that tracks your live OEE score, helping your production line make adjustments on the fly. Data is aggregated into reporting trends to help management make strategic supply chain decisions.
Our tools help you improve OEE by tackling each component and drive a comprehensive improvement strategy.
- Availability — Understand Availability losses with Advanced data collection across all assets with ABLE our Data Collection Accelerator.
- Quality — Alert on issues, manage quality and maintain compliance with our Process Correction Accelerator
- Performance — Keep your plant humming and improve your manufacturing processes with Manufacturing Intelligence Software
- Analysis — Monitor all your data in real time with OneView, our cloud-based OEE Reporting Accelerator.
Read our Groundbreaking OEE Benchmark Study to See How You Measure Up
Our researchers analyzed over 500,000 causes of downtime over 3 months of minute-by-minute, real-time, production data captured from companies around the world in various industries.
We studied global manufacturing operations worldwide to benchmark performance and correlate over 20 manufacturing KPIs. Researchers used the Epicor Informance EMI and Clarity Advisory services to collect data, derive insight and discover correlations to operational success of tactical and strategic actions.
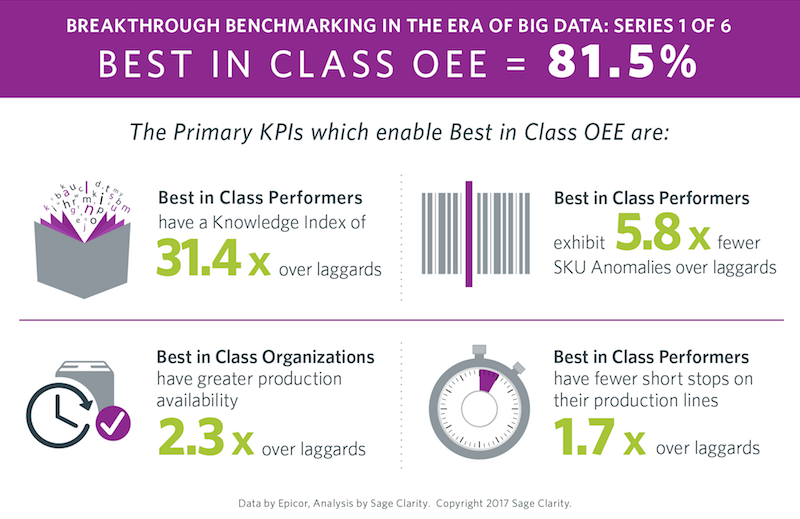
Read the benchmark study to learn which KPIs have the strongest correlation with best-in-class OEE. Sage Clarity has the tools you need to help measure KPIs and systematically improve your OEE. Learn more about what factors can positively impact your predicted OEE.
Track Your Operational Efficiency in Real-time. In one plant, or around the world.

OEE Dashboard from OneView
Take continuous improvement to the next level with OEE analytics deployed in the cloud and available on desktop or mobile device. Get metrics for a single plant or across an enterprise. Flexible deployment options means you can pull up OEE metrics in a board meeting, or while you’re standing on the plant floor.
Metrics Include:
- OEE Total Time
- OEE Schedule Time
- TEEP analysis
- Production Trends
- Downtime and OEE Pareto charts
- Corporate Waterfall analysis
- And more…
Monitor Your OEE Dashboard Across Devices
Cross-device deployment means you can continuously improve your production output from anywhere. See important KPIs at a glance on your iPhone, iPad, or Android device, including total downtime hours, scrap trends, production totals, line efficiency, and more.


IMPROVE PLANT AVAILABILITY WITH ANDON
Go beyond downtime issues and track Safety, Quality, engineering, and more. Our next-gen Andon system utilizes existing Operator HMIs and plant floor terminals to send smart email alerts.
How you can BENEFIT from NEXT-GEN ANDON:
- Improved communication between operators and engineers
- Digital signage combined with focused email alerts to maximize who is notified of issues
- Keep the right people informed through role-based alert system and increase your opportunity for continuous improvement
- Operational insight integrates machine-related and non-machine related issues into one system
Measure Performance with EMI Software
Gain real and actionable insight into manufacturing improvement opportunities for your business – within the individual plant or across the entire enterprise. See production, downtime, and financial reporting through one unified dashboard.
- Manage compliance through traceability throughout your supply chain
- Downtime reports by shift, by say, by week, or your time horizon
- Out of the box real-time analytics that can be drilled down by location, division, plant or line

