Batch Cycle Optimization
Our new ABLE add-on enables your team to turbocharge your batch time. By collecting edge data via PLC or manual entry from operators, you get real visibility into your batch cycle time. This tool will help you go from your perceived batch cycle time to understanding the actual cycle time, including where you can improve.
Improve batch cycle time

- ABLE integrates IoT edge data into business systems—MES, SCADA, and ERPs.
- Reduce your “non value added” time elements to complete batches faster
- Faster batch cycles let’s you create smaller batch sizes
- Reduce “waiting time” for downstream operations
Closing the Perception Gap
The business case for understanding batch cycle time.
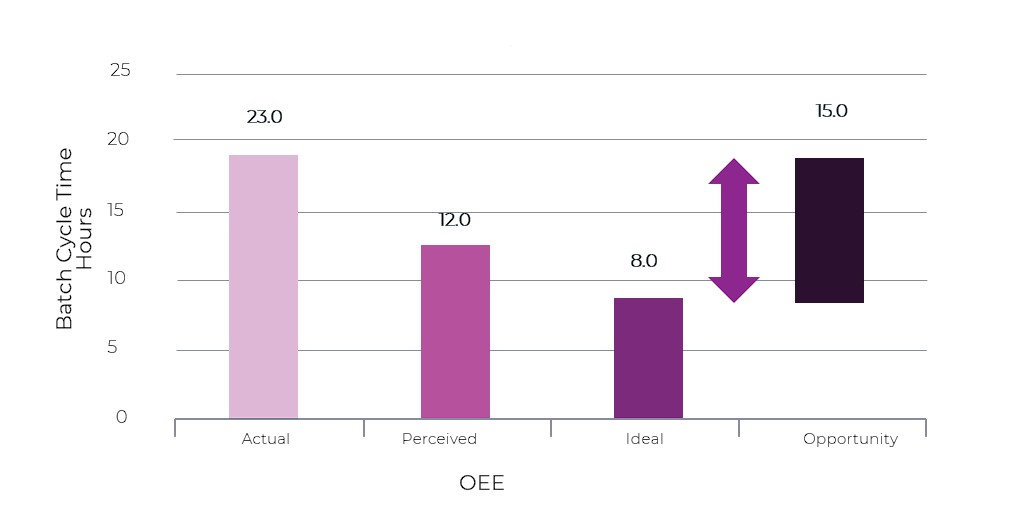
- In the example, a client thought their batch cycle time was 12 hours
- We learned their actual cycle time was 23 hours after measuring their batch cycle in real-time
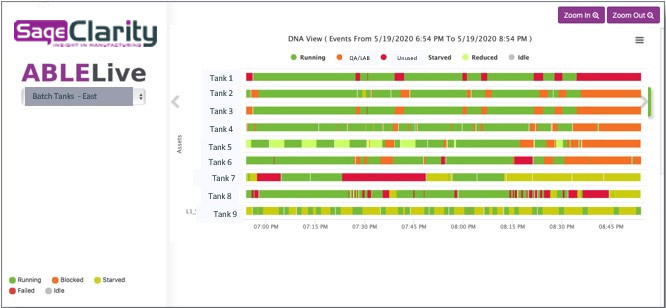
- Almost 50% of their cycle time was tied up in lab approvals
- By conducting a value stream analysis, we found that an 8-hour cycle time was attainable
How ABLE Collects Data
Data Collection
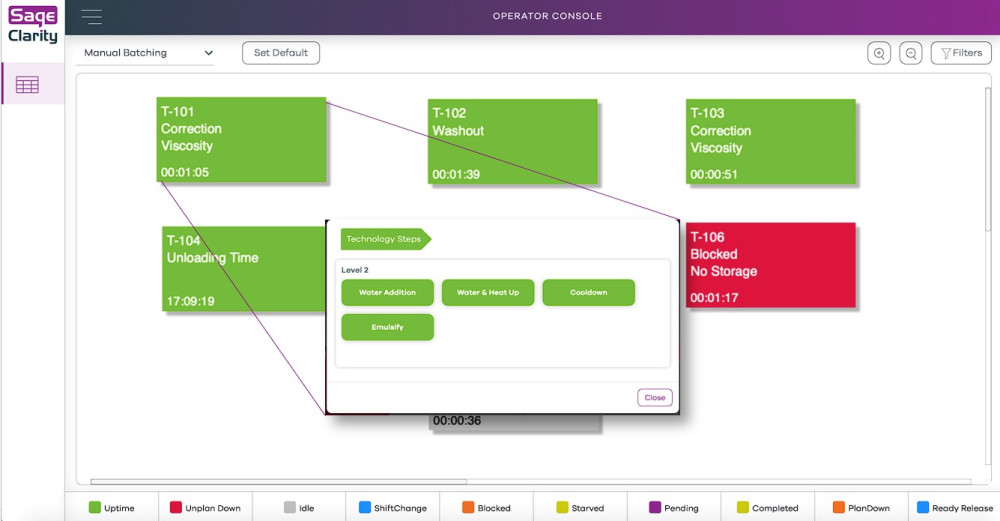
- The ABLE State engine creates process events used for comprehensive batch analysis.
- The State engine has an operator interface for entering batch states
- Batch states can also be generated from PLCs or DCS systems
- Batch states can be turned on/off or changed from the operator interface.
Visibility
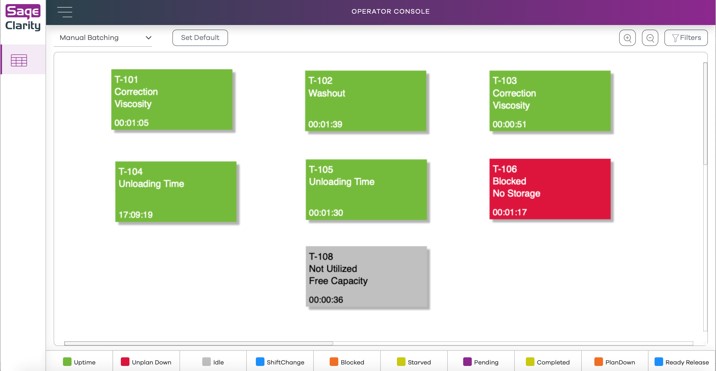
- Real-time tank status is provided as part of the utility.
Analysis
- Analysis is done through another MES App, One View, or through a standard BI plug in for use with tools such PowerBI, SQL Reporting, SAP Hana, etc.
Tank running hours for SAP
- The state engine utility has a data interface for sending the batch events details to SAP or other sysems
Phases of Batch Cycle Times
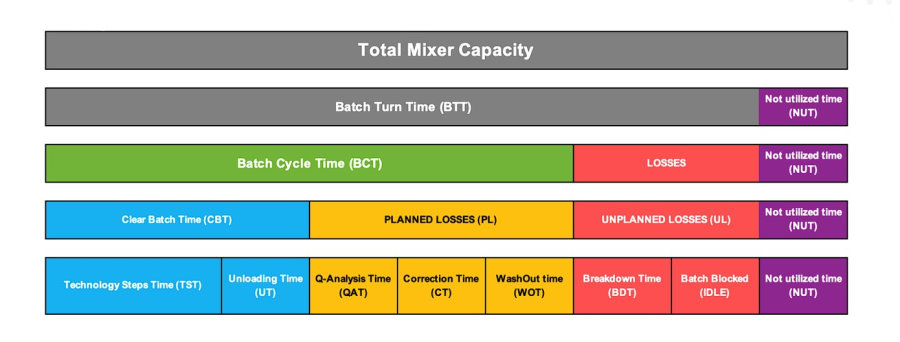
| Not Utilized Capacity (NUC) | Planned Losses (PL) |
| Bank Holiday | Analysis |
| Free Capacity | Correction |
| Planned Maintenance | Washout |
| Trials | |
| Clear Batch Time (CBT) | Unplanned Losses (UL) |
| Technology Steps (Batching) | No Raw Materials |
| Preloading | Technical Breakdown |
| Unloading Time | Personnel |
| No Storage Container | |
| Running to Filling Line |
Integrate Batch Status with Your MES
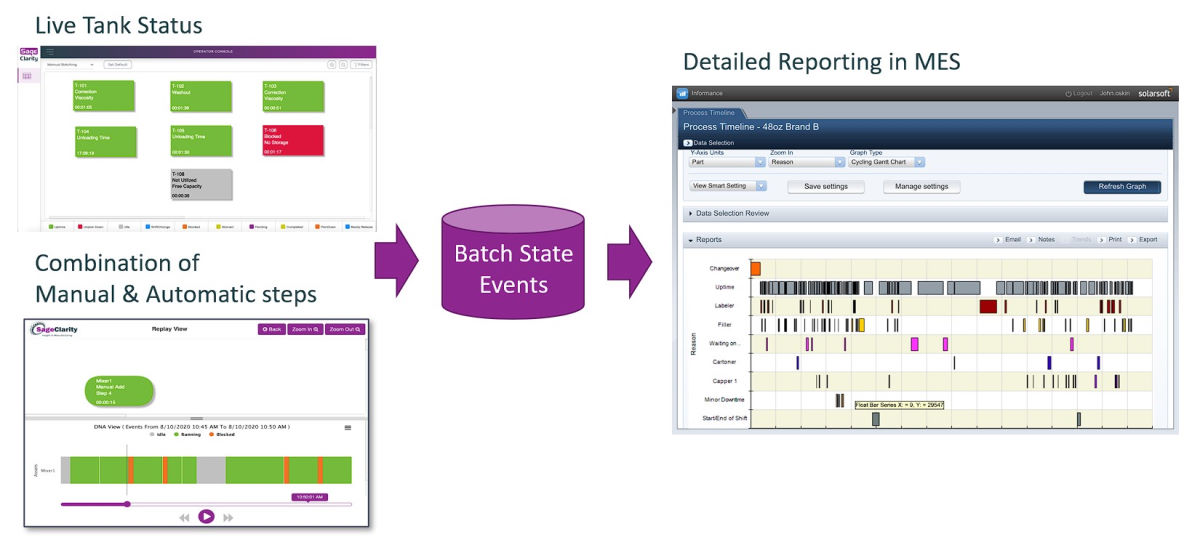
ABLE™ actively monitors your batch times and provides information in real time. The batch state utility has the following capabilities:
- Ability to enforce a sequence or allow free entry of batch steps
- Creates time accountability — all time must be accounted for and tracked
- Sub-reason selection is tied to a primary reason
- Integrate with MES systems, as well as BI tools like SAP and PowerBI
Multiple Views for Batch Analysis
Real-time, Historical, and Gant-style DNA View
Live Tank Status
Tank Status History

Tank Status DNA View
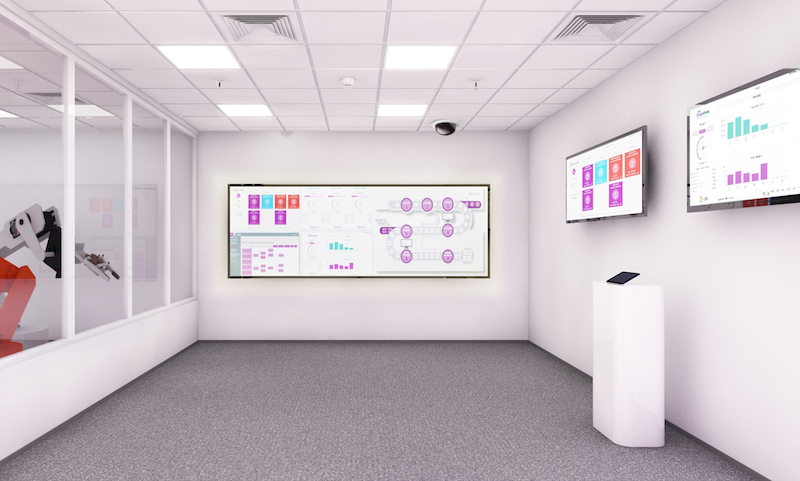
ABLE™ is Your IIoT Gateway for Cloud Computing
Skip PLC programming. Integrate PLC data directly into your MES & ERP.
ABLE enables transforming IoT data into business systems (MES, SCADA, ERP apps, etc.).
A lightweight, root-cause IoT solution that leverages OPC UA technology and allows enterprises to simplify control architectures. With an OPC and cloud-based configuration solution, you don’t need a concentrator PLC. Connect to each PLC on the line directly and correlate the data across PLCs. Removing data storage and data transformations from PLCs allows enterprises to treat the PLC as an IoT device, simplifying their control architectures.
ABLE is ISA-95 compliant and works with the standard to allow it to determine state logic. ISA-95 is an standard from the International Society of Automation for developing an automated interface between enterprise and control systems.
ABLE is now also SAML 2.0 compliant, ensuring that access to business platforms is easy and more secure.
How your production benefits:
- Less cost – Reduces integration cost for AutoTagging by 50% to provide faster return on investment.
- Less coding – Reduces PLC Programming for AutoTagging by over 80%
- Less miscues – Accurately identifies, tags and reports root causes for line stops, to let you improve line efficiency… more efficiently.
- Less noise – Enhances analytics to specifically identify root cause, not symptoms to build trust in reporting.
- Less hassle – Reduces cost associated with change management by over 80% by housing the code remotely.


