
25 Jan OEE Benchmarks – Infographic series
OEE Benchmarks
What better way to start the new year than to lead off with a set of manufacturing performance benchmarks.
Today’s manufacturers place the highest level of importance on the quest for operational efficiencies. Many manufacturers face only capacity constraints – the more they make, the more they can sell. Other manufacturers with fairly constant demand, focus efforts on reducing labor, inventory and capital costs. Manufacturers achieve these objectives through operational performance initiatives such a Lean Manufacturing, Six-Sigma, TPM and TQM. Leading manufacturers identify opportunities for improvements by measuring key performance indicators (KPIs) within and across facilities on an ongoing basis. Periodically, Sage Clarity studies manufacturing operations worldwide. Researchers used The Epicor Manufacturing Intelligence Suite, and Clarity Advisory Services to collect data, derive insight and discover correlations to operational success of tactical and strategic actions.
[optin-monster-inline slug=”qloggraxd3payfghmxer”]
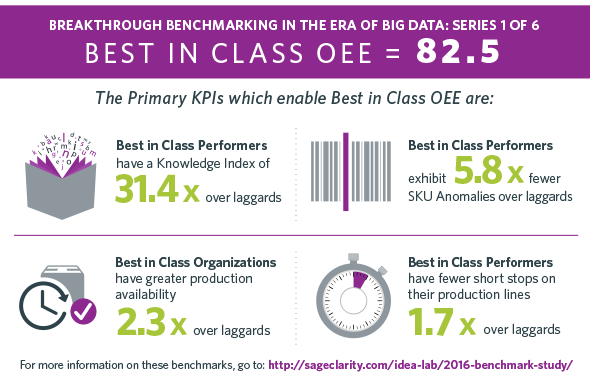
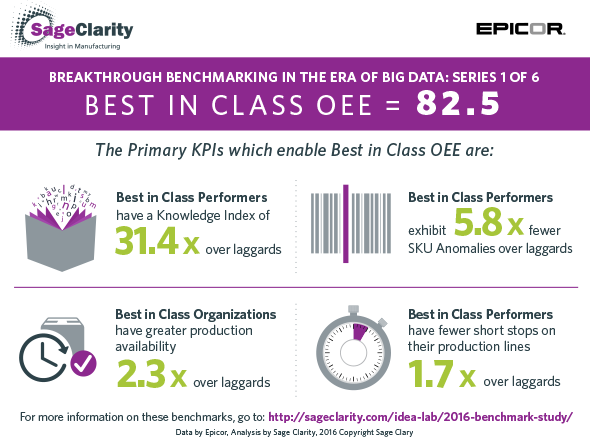
To determine a manufacturer’s competitive position, we use overall equipment effectiveness (OEE) as the top indicator of performance. We rank each manufacturer by OEE and view all other key performance indicators (KPIs) in context of this order. The average of the top 25% of each KPI denotes best-in-class performance for that KPI, the average of the middle 50th percentile represents average performance, and the average of the bottom 25th percentile represents laggard performance.
Below are some additional useful links:
Food Engineering Benchmark Study
