
26 Apr OEE Benchmark Study Summary
Executive Summary: Manufacturing Performance OEE Benchmark Study For Fast Moving Consumer Goods
Manufacturing organizations undertake a variety of performance improvement initiatives such as Lean Manufacturing, Six-Sigma, TPM and TQM. Organizations leverage KPIs, including Overall Equipment Effectiveness (OEE) to manage and measure such initiatives.
Read our OEE benchmark report for 2018 >
Sage Clarity studied global manufacturing operations worldwide to benchmark performance and correlate over 20 manufacturing KPIs. Researchers used the Epicor/Informance Enterprise Manufacturing Intelligence Suite and Clarity advisory services to collect data, derive insight and discover correlations to operational success of tactical and strategic actions.
Key Findings
Overall Equipment Effectiveness (OEE) for all Tiers
Leveraging the Tier Ranking Methodology (see next section), the analysis reveals the OEE measure for each tier and the sizeable gap between Best-in-Class performers vs. Laggards.
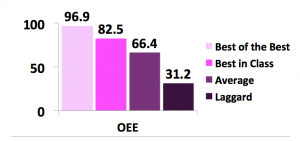 On average, Best-in-Class organizations, exhibit an OEE 2.6x better than
Laggards, due to an OEE of 82.5 vs. 31.2:
(82.5 / 31.2 = 2.6)
From this stack ranking, we then correlate related KPIs to each tier to determine attributes and behaviors of these tiers: which KPIs impact OEE, either positively or adversely.
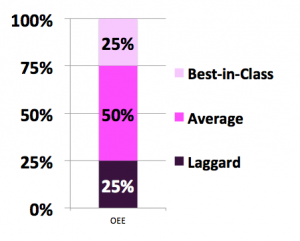
Tier Ranking Methodology
The analysis begins by establishing OEE as the Best-in-Class determinant: Higher OEE indicates better performance. All organizations are sorted from high to low by OEE, and related KPIs are then correlated to determine KPIs that impact performance.
| Tier | Definition |
|---|---|
| Best-in Class OEE | Ranks in the Top 25% |
| Average OEE | Ranks in the Middle 50% |
| Laggard OEE | Ranks in the Bottom 25% |
Learn how Sage Clarity OEE software can improve your operations >
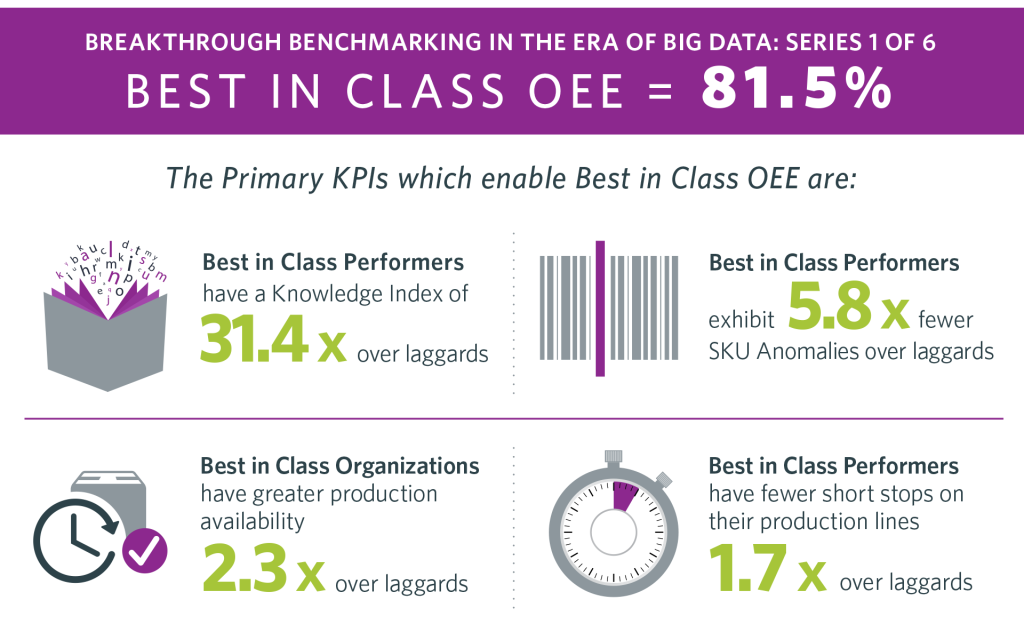
What do Best-in-Class organizations do to achieve high performance?
The study reveals several operational KPIs that are crucial to performance:
| KPI | Definitions |
|---|---|
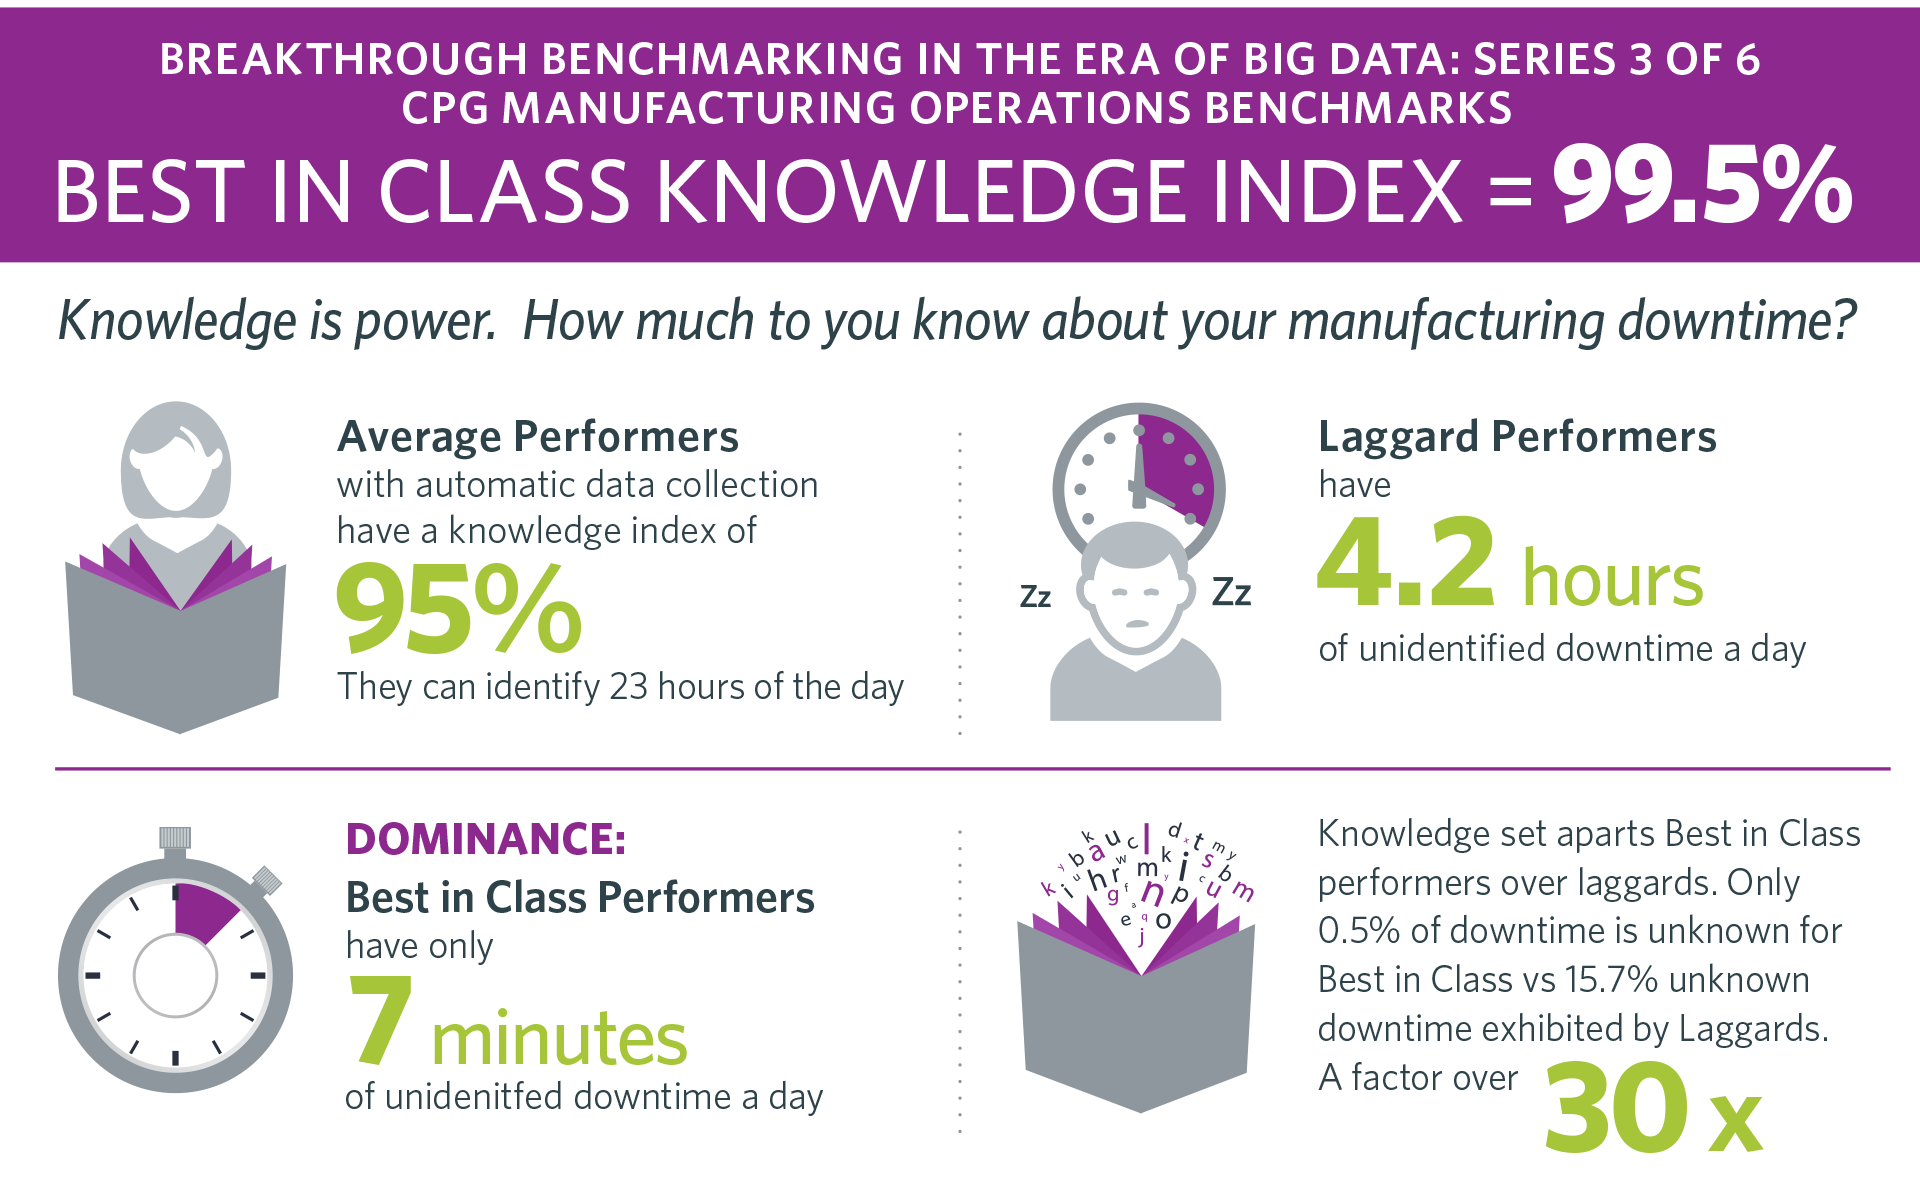
| Knowledge Index | Percent of untagged downtime |
| SKU Anomalies | SKUs that exhibit a production rate of +/- 10% of ideal production rate for the SKU. |
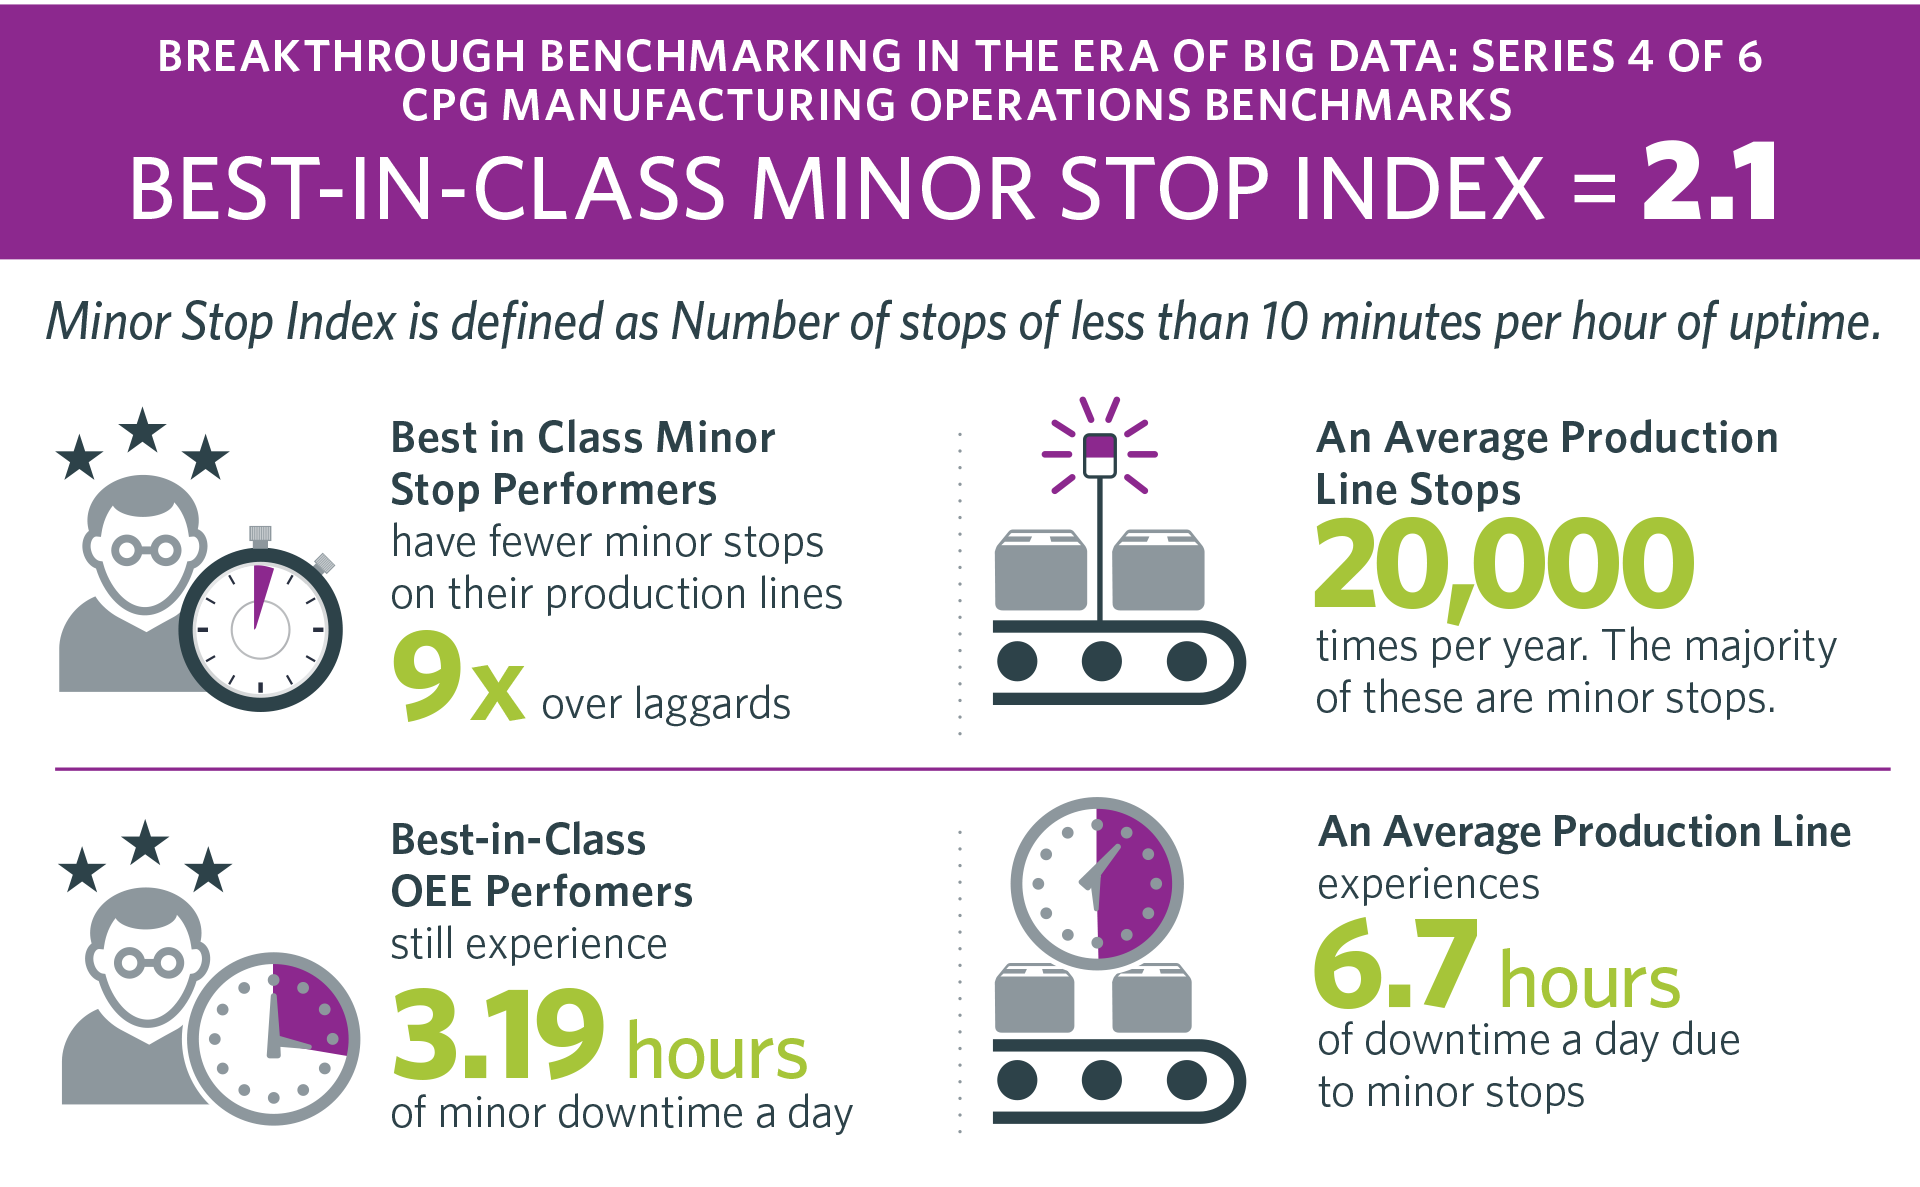
| Minor Stop Index | Number of minor stops per hour (minor stop = stop of a duration of 10 minutes or less) |
| Availability | Uptime over Scheduled Time |
Two KPIs Critical to Performance: Knowledge Index and Minor Stop Index
Knowledge Index
Minor Stop Index
What Should I Do?
If OEE>70%: Best-in-Class Performers and Average Performers:
- Focus on reduction in short-stops, which can correlate to better availability. Availability is the KPI most adversely affecting OEE.
If OEE is between 50 – 70%: Average Performers:
- Focus on programs which reduce/eliminate equipment failure, which correlates to unplanned major downtime, another KPI affecting OEE.
If OEE is between 30 and 50%: Laggard Performers:
- Focus on tagging downtime events regardless of duration to provide improvement insights
- Focus on reducing equipment failure that can lead to significant amounts of major downtime, impacting availability and thus, OEE.
For More Information
This Executive Summary contains a small subset of the insights and actions that organizations can take—both strategic and tactical to improve performance. To schedule a briefing on the full study, contact Sage Clarity. During this exclusive briefing you will learn insights and strategies gathered during the study. You will also have the opportunity to ask questions about how to adapt these best-in-class strategies to your business.
Read our OEE benchmark report for 2018 >
